World Bank
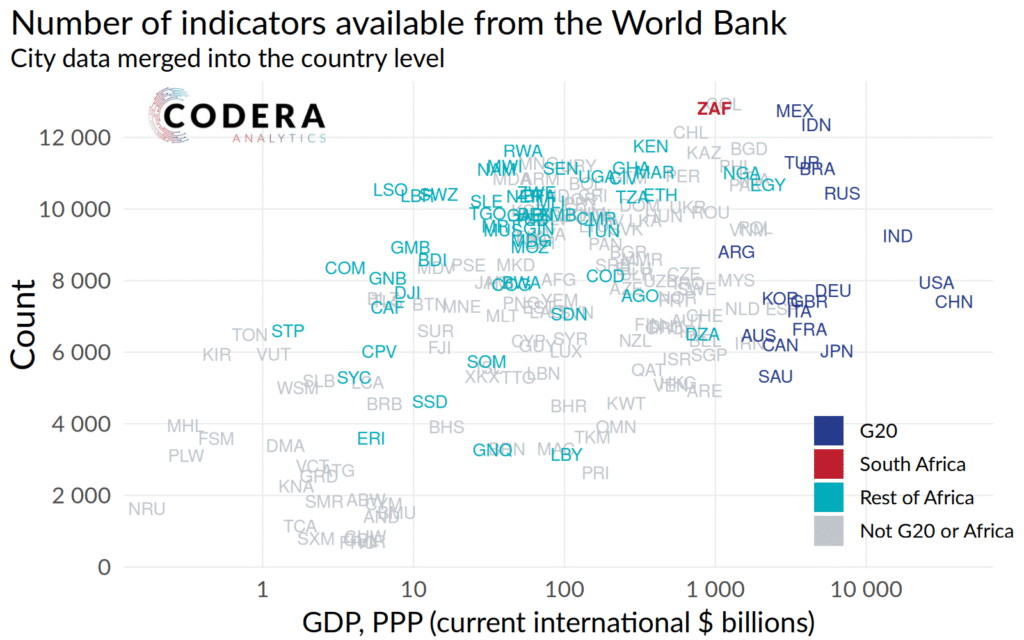
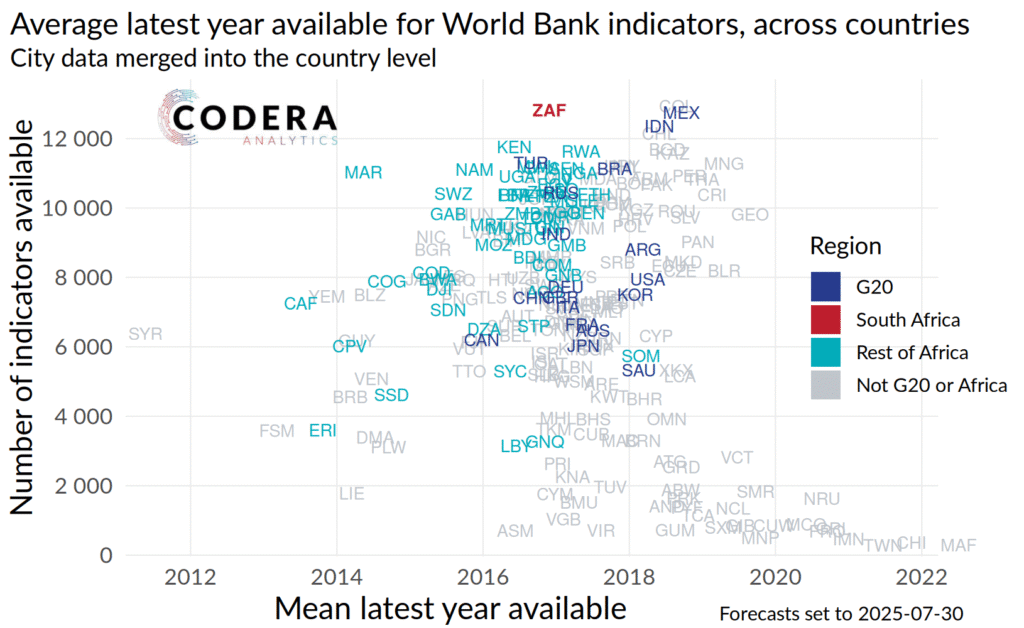
We periodically download all the available data from the World Bank API (usually on an annual basis), resulting in over 21 000 series, observed across 219 countries.
Click here to see two charts summarizing all the available data.
Selection of a smaller set of data
This combination of indicators and countries results in 1.7 million series (or almost 24 million data points including the time dimension, after dropping missing values), so we make some decisions to reduce the number of series we provide. Firstly, we only provide the top 100 countries in terms of the latest PPP GDP. This excludes countries such as Zambia (in 103rd position), Mali (in 114th position), Iceland (147th position), Bermuda (163rd position), Comoros (180th position) and lastly Tuvalu (199th position, with a GDP of PPP$ 57 million in 2023).
Dataflows
We split up the data into manageable dataflows using the World Bank’s official indicator categories:
- Agriculture & Rural Development
- Aid Effectiveness
- Climate Change
- Economy & Growth
- Education
- Energy & Mining
- Environment
- External Debt
- Financial Sector
- Gender
- Global Economic Monitor
- Health
- Infrastructure
- Poverty
- Private Sector
- Public Sector
- Science & Technology
- Social Development
- Social Protection & Labor
- Trade
- Urban Development
These categories only cover about 5000 indicators, as not all indicators are categorised in the World Bank API. Furthermore, the indicators from the Global Economic Monitor source are also not categorised into topics, but we want to include this source, so we explicitly include this source as a separate dataflow.
Further selection
We then prune those 5000 indicators down further, seeking to make the scale more approachable for our users as an initial release of the data. We use Gemini’s artificial intelligence to create an economic importance score of the 5000 series, based on the names and descriptions. We use this importance score to filter the list to about 570 indicators. We then categorise this final selection into the dataflow categories. If there are series that you need that we have not chosen, please ask us to include those series.
Attributes
- Source Dataset (known as ‘Source Organization’ in the World Bank API) Examples:
- World Bank, International Debt Statistics.
- World Development Indicators (World Bank)
- United Nations, World Urbanization Prospects.
- Food and Agriculture Organization, AQUASTAT data, and World Bank and OECD GDP estimates.
- Frequency (e.g. annual)
- Data presentation – summary description
Concept ID:DATA_DESCR
Definition: Main characteristics of the data set described in an easily understandable manner, referring to the data and indicators disseminated.
Example: “The consumer price index reflects the change in prices for the average consumer of a constant basket of consumer goods. Data is not seasonally adjusted.” - Data provider
Concept ID:DATA_PROVIDER
Definition: Organisation or individual that reports or disseminates data or reference metadata.
Example: World Development Indicators - Source Identifier: original indicator ID used by the World Bank
- Comment
Example: “”There is a discontinuity in 1991 caused by Statistics New Zealand’s change from ‘de facto’ to ‘resident’ population estimates.” - Label: Used for your analysis, and for our EconData app. This is composed of the ISO two-character country code, followed by the indicator name.
- Base Period
- Unit of Measure (we still need to improve the metadata in this concept)
- Release description: date on which we downloaded all the data in this vintage
Dimensions
1. Indicator
The first encoded dimension is the indicator code, which is mapped to the indicator name in the respective codelist for that dataflow. After each dataflow heading below, we write the dataflow ID. Please click on this paragraph to see the full list.
Agriculture & Rural Development WB_AGRI_RURAL
- Access to electricity, rural (% of rural population)
EGELCACCSRUZS - Rural population living in areas where elevation is below 5 meters (% of total population)
ENPOPEL5MRUZS - Agriculture, forestry, and fishing, value added (% of GDP)
NVAGRTOTLZS - Employment in agriculture, female (% of female employment) (modeled ILO estimate)
SLAGREMPLFEZS - Employment in agriculture, male (% of male employment) (modeled ILO estimate)
SLAGREMPLMAZS - Employment in agriculture (% of total employment) (modeled ILO estimate)
SLAGREMPLZS - Rural population growth (annual %)
SPRURTOTLZG - Rural population (% of total population)
SPRURTOTLZS
Aid Effectiveness WB_AID
- Net official flows from UN agencies, FAO (current US$)
DTNFLFAOGCD - Net official flows from UN agencies, IAEA (current US$)
DTNFLIAEACD - Net official flows from UN agencies, IFAD (current US$)
DTNFLIFADCD - Net official flows from UN agencies, ILO (current US$)
DTNFLILOGCD - Net official flows from UN agencies, UNAIDS (current US$)
DTNFLUNAICD - Net official flows from UN agencies, UNICEF (current US$)
DTNFLUNCFCD - Net official flows from UN agencies, UNHCR (current US$)
DTNFLUNCRCD - Net official flows from UN agencies, UNDP (current US$)
DTNFLUNDPCD - Net official flows from UN agencies, UNECE (current US$)
DTNFLUNECCD - Net official flows from UN agencies, UNFPA (current US$)
DTNFLUNFPCD - Net official flows from UN agencies, UNPBF (current US$)
DTNFLUNPBCD - Net official flows from UN agencies, UNRWA (current US$)
DTNFLUNRWCD - Net official flows from UN agencies, UNTA (current US$)
DTNFLUNTACD - Net official flows from UN agencies, UNWTO (current US$)
DTNFLUNWTCD - Net official flows from UN agencies, WFP (current US$)
DTNFLWFPGCD - Net official flows from UN agencies, WHO (current US$)
DTNFLWHOLCD - Net official development assistance and official aid received (current US$)
DTODAALLDCD - Net official development assistance and official aid received (constant 2021 US$)
DTODAALLDKD - Net official development assistance received (current US$)
DTODAODATCD - Net ODA received (% of gross capital formation)
DTODAODATGIZS - Net ODA received (% of GNI)
DTODAODATGNZS - Net official development assistance received (constant 2021 US$)
DTODAODATKD - Net ODA received (% of imports of goods, services and primary income)
DTODAODATMPZS - Net ODA received per capita (current US$)
DTODAODATPCZS - Net ODA received (% of central government expense)
DTODAODATXPZS - School enrollment, primary and secondary (gross), gender parity index (GPI)
SEENRPRSCFMZS
Climate Change WB_CLIMATE
- Urban population living in areas where elevation is below 5 meters (% of total population)
ENPOPEL5MURZS - Population living in areas where elevation is below 5 meters (% of total population)
ENPOPEL5MZS - Population in urban agglomerations of more than 1 million (% of total population)
ENURBMCTYTLZS - CPIA public sector management and institutions cluster average (1=low to 6=high)
IQCPAPUBSXQ - Population growth (annual %)
SPPOPGROW - Population, total
SPPOPTOTL - Urban population growth (annual %)
SPURBGROW - Urban population (% of total population)
SPURBTOTLINZS
Economy & Growth WB_ECONOMY
- GDP growth (annual %)
60GDPGROWTH - GDP per capita, PPP (constant 2011 international $)
60GDPPCCONSTANT - GDP (constant 2005 $)
60GDPUSD - GNI per capita (2011 $)
60GNIPC - Trade in services (% of GDP)
BGGSRNFSVGDZS - Imports of goods and services (BoP, current US$)
BMGSRGNFSCD - Insurance and financial services (% of service imports, BoP)
BMGSRINSFZS - Imports of goods, services and primary income (BoP, current US$)
BMGSRTOTLCD - Foreign direct investment, net outflows (% of GDP)
BMKLTDINVWDGDZS - Current account balance (BoP, current US$)
BNCABXOKACD - Current account balance (% of GDP)
BNCABXOKAGDZS - Net trade in goods and services (BoP, current US$)
BNGSRGNFSCD - Net trade in goods (BoP, current US$)
BNGSRMRCHCD - Foreign direct investment, net (BoP, current US$)
BNKLTDINVCD - ICT service exports (BoP, current US$)
BXGSRCCISCD - ICT service exports (% of service exports, BoP)
BXGSRCCISZS - Exports of goods and services (BoP, current US$)
BXGSRGNFSCD - Exports of goods, services, income and workers’ remittances (BoP, current US$)
BXGSRINCLCD - Insurance and financial services (% of service exports, BoP)
BXGSRINSFZS - Exports of goods, services and primary income (BoP, current US$)
BXGSRTOTLCD - Foreign direct investment, net inflows (BoP, current US$)
BXKLTDINVCDWD - Foreign direct investment, net inflows (% of GDP)
BXKLTDINVWDGDZS - External debt stocks (% of GNI)
DTDODDECTGNZS - Short-term debt (% of total reserves)
DTDODDSTCIRZS - Short-term debt (% of exports of goods, services and primary income)
DTDODDSTCXPZS - Present value of external debt (% of exports of goods, services and primary income)
DTDODPVLXEXZS - Total debt service (% of exports of goods, services and primary income)
DTTDSDECTEXZS - Total debt service (% of GNI)
DTTDSDECTGNZS - Inflation, consumer prices (annual %)
FPCPITOTLZG - Central government debt, total (% of GDP)
GCDODTOTLGDZS - Households and NPISHs Final consumption expenditure per capita (constant 2015 US$)
NECONPRVTPCKD - Households and NPISHs Final consumption expenditure per capita growth (annual %)
NECONPRVTPCKDZG - Exports of goods and services (current US$)
NEEXPGNFSCD - Exports of goods and services (current LCU)
NEEXPGNFSCN - Exports of goods and services (constant 2015 US$)
NEEXPGNFSKD - Exports of goods and services (annual % growth)
NEEXPGNFSKDZG - Exports of goods and services (constant LCU)
NEEXPGNFSKN - Exports of goods and services (% of GDP)
NEEXPGNFSZS - Gross capital formation (current US$)
NEGDITOTLCD - Gross capital formation (current LCU)
NEGDITOTLCN - Gross capital formation (constant 2015 US$)
NEGDITOTLKD - Gross capital formation (annual % growth)
NEGDITOTLKDZG - Gross capital formation (constant LCU)
NEGDITOTLKN - Gross capital formation (% of GDP)
NEGDITOTLZS - Imports of goods and services (current US$)
NEIMPGNFSCD - Imports of goods and services (current LCU)
NEIMPGNFSCN - Imports of goods and services (constant 2015 US$)
NEIMPGNFSKD - Imports of goods and services (annual % growth)
NEIMPGNFSKDZG - Imports of goods and services (constant LCU)
NEIMPGNFSKN - Imports of goods and services (% of GDP)
NEIMPGNFSZS - External balance on goods and services (% of GDP)
NERSBGNFSZS - Trade (% of GDP)
NETRDGNFSZS - Agriculture, forestry, and fishing, value added (annual % growth)
NVAGRTOTLKDZG - Financial intermediary services indirectly Measured (FISIM) (current LCU)
NVFSMTOTLCN - Financial intermediary services indirectly Measured (FISIM) (constant LCU)
NVFSMTOTLKN - Manufacturing, value added (annual % growth)
NVINDMANFKDZG - Manufacturing, value added (% of GDP)
NVINDMANFZS - Industry (including construction), value added (current US$)
NVINDTOTLCD - Industry (including construction), value added (current LCU)
NVINDTOTLCN - Industry (including construction), value added (constant 2015 US$)
NVINDTOTLKD - Industry (including construction), value added (annual % growth)
NVINDTOTLKDZG - Industry (including construction), value added (constant LCU)
NVINDTOTLKN - Industry (including construction), value added (% of GDP)
NVINDTOTLZS - Other manufacturing (% of value added in manufacturing)
NVMNFOTHRZSUN - Medium and high-tech manufacturing value added (% manufacturing value added)
NVMNFTECHZSUN - Services, value added per worker (constant 2015 US$)
NVSRVEMPLKD - Services, value added (current US$)
NVSRVTOTLCD - Services, value added (current LCU)
NVSRVTOTLCN - Services, value added (constant 2015 US$)
NVSRVTOTLKD - Services, value added (annual % growth)
NVSRVTOTLKDZG - Services, value added (constant LCU)
NVSRVTOTLKN - Services, value added (% of GDP)
NVSRVTOTLZS - Adjusted savings: education expenditure (current US$)
NYADJAEDUCD - Adjusted savings: education expenditure (% of GNI)
NYADJAEDUGNZS - Inflation, GDP deflator (annual %)
NYGDPDEFLKDZG - Discrepancy in expenditure estimate of GDP (constant LCU)
NYGDPDISCKN - Gross value added at basic prices (GVA) (current US$)
NYGDPFCSTCD - Gross value added at basic prices (GVA) (current LCU)
NYGDPFCSTCN - Gross value added at basic prices (GVA) (constant 2015 US$)
NYGDPFCSTKD - Gross value added at basic prices (GVA) (constant LCU)
NYGDPFCSTKN - GDP (current US$)
NYGDPMKTPCD - GDP (current LCU)
NYGDPMKTPCN - GDP (constant 2015 US$)
NYGDPMKTPKD - GDP growth (annual %)
NYGDPMKTPKDZG - GDP (constant LCU)
NYGDPMKTPKN - GDP, PPP (current international $)
NYGDPMKTPPPCD - GDP, PPP (constant 2021 international $)
NYGDPMKTPPPKD - GDP per capita (current US$)
NYGDPPCAPCD - GDP per capita (current LCU)
NYGDPPCAPCN - GDP per capita (constant 2015 US$)
NYGDPPCAPKD - GDP per capita growth (annual %)
NYGDPPCAPKDZG - GDP per capita (constant LCU)
NYGDPPCAPKN - GDP per capita, PPP (current international $)
NYGDPPCAPPPCD - GDP per capita, PPP (constant 2021 international $)
NYGDPPCAPPPKD - Gross domestic savings (% of GDP)
NYGDSTOTLZS - GNI, Atlas method (current US$)
NYGNPATLSCD - GNI growth (annual %)
NYGNPMKTPKDZG - GNI, PPP (current international $)
NYGNPMKTPPPCD - GNI, PPP (constant 2021 international $)
NYGNPMKTPPPKD - GNI per capita, Atlas method (current US$)
NYGNPPCAPCD - GNI per capita (current LCU)
NYGNPPCAPCN - GNI per capita (constant 2015 US$)
NYGNPPCAPKD - GNI per capita growth (annual %)
NYGNPPCAPKDZG - GNI per capita (constant LCU)
NYGNPPCAPKN - GNI per capita, PPP (current international $)
NYGNPPCAPPPCD - GNI per capita, PPP (constant 2021 international $)
NYGNPPCAPPPKD - Terms of trade adjustment (constant LCU)
NYTTFGNFSKN
Education WB_EDUCATION
- Barro-Lee: Percentage of female population age 15-19 with no education
BARNOED1519FEZS - Barro-Lee: Percentage of population age 15-19 with no education
BARNOED1519ZS - Barro-Lee: Percentage of female population age 15+ with no education
BARNOED15UPFEZS - Barro-Lee: Percentage of population age 15+ with no education
BARNOED15UPZS - Barro-Lee: Percentage of female population age 20-24 with no education
BARNOED2024FEZS - Barro-Lee: Percentage of population age 20-24 with no education
BARNOED2024ZS - Barro-Lee: Percentage of female population age 25-29 with no education
BARNOED2529FEZS - Barro-Lee: Percentage of population age 25-29 with no education
BARNOED2529ZS - Barro-Lee: Percentage of female population age 25+ with no education
BARNOED25UPFEZS - Barro-Lee: Percentage of population age 25+ with no education
BARNOED25UPZS - Barro-Lee: Percentage of female population age 30-34 with no education
BARNOED3034FEZS - Barro-Lee: Percentage of population age 30-34 with no education
BARNOED3034ZS - Barro-Lee: Percentage of female population age 35-39 with no education
BARNOED3539FEZS - Barro-Lee: Percentage of population age 35-39 with no education
BARNOED3539ZS - Barro-Lee: Percentage of female population age 40-44 with no education
BARNOED4044FEZS - Barro-Lee: Percentage of population age 40-44 with no education
BARNOED4044ZS - Barro-Lee: Percentage of female population age 45-49 with no education
BARNOED4549FEZS - Barro-Lee: Percentage of population age 45-49 with no education
BARNOED4549ZS - Barro-Lee: Percentage of female population age 50-54 with no education
BARNOED5054FEZS - Barro-Lee: Percentage of population age 50-54 with no education
BARNOED5054ZS - Barro-Lee: Percentage of female population age 55-59 with no education
BARNOED5559FEZS - Barro-Lee: Percentage of population age 55-59 with no education
BARNOED5559ZS - Barro-Lee: Percentage of female population age 60-64 with no education
BARNOED6064FEZS - Barro-Lee: Percentage of population age 60-64 with no education
BARNOED6064ZS - Literacy rate, youth female (% of females ages 15-24)
SEADT1524LTFEZS - Literacy rate, youth (ages 15-24), gender parity index (GPI)
SEADT1524LTFMZS - Literacy rate, youth male (% of males ages 15-24)
SEADT1524LTMAZS - Literacy rate, youth total (% of people ages 15-24)
SEADT1524LTZS - Literacy rate, adult male (% of males ages 15 and above)
SEADTLITRMAZS - Literacy rate, adult total (% of people ages 15 and above)
SEADTLITRZS - School enrollment, primary (gross), gender parity index (GPI)
SEENRPRIMFMZS - School enrollment, secondary (gross), gender parity index (GPI)
SEENRSECOFMZS - School enrollment, tertiary (gross), gender parity index (GPI)
SEENRTERTFMZS - School enrollment, preprimary (% gross)
SEPREENRR - School enrollment, preprimary, female (% gross)
SEPREENRRFE - School enrollment, preprimary, male (% gross)
SEPREENRRMA - Trained teachers in preprimary education (% of total teachers)
SEPRETCAQZS - Educational attainment, at least completed primary, population 25+ years, female (%) (cumulative)
SEPRMCUATFEZS - Educational attainment, at least completed primary, population 25+ years, male (%) (cumulative)
SEPRMCUATMAZS - Educational attainment, at least completed primary, population 25+ years, total (%) (cumulative)
SEPRMCUATZS - School enrollment, primary (% gross)
SEPRMENRR - School enrollment, primary, female (% gross)
SEPRMENRRFE - School enrollment, primary, male (% gross)
SEPRMENRRMA - School enrollment, primary (% net)
SEPRMNENR - School enrollment, primary, female (% net)
SEPRMNENRFE - School enrollment, primary, male (% net)
SEPRMNENRMA - Trained teachers in primary education (% of total teachers)
SEPRMTCAQZS - Educational attainment, at least completed lower secondary, population 25+, female (%) (cumulative)
SESECCUATLOFEZS - Educational attainment, at least completed lower secondary, population 25+, male (%) (cumulative)
SESECCUATLOMAZS - Educational attainment, at least completed lower secondary, population 25+, total (%) (cumulative)
SESECCUATLOZS - Educational attainment, at least completed post-secondary, population 25+, female (%) (cumulative)
SESECCUATPOFEZS - Educational attainment, at least completed post-secondary, population 25+, male (%) (cumulative)
SESECCUATPOMAZS - Educational attainment, at least completed post-secondary, population 25+, total (%) (cumulative)
SESECCUATPOZS - Educational attainment, at least completed upper secondary, population 25+, female (%) (cumulative)
SESECCUATUPFEZS - Educational attainment, at least completed upper secondary, population 25+, male (%) (cumulative)
SESECCUATUPMAZS - Educational attainment, at least completed upper secondary, population 25+, total (%) (cumulative)
SESECCUATUPZS - Share of male students in secondary education enrolled in vocational programmes (%)
SESECENRLMAVOZS - Share of all students in secondary education enrolled in vocational programmes (%)
SESECENRLVOZS - School enrollment, secondary (% gross)
SESECENRR - School enrollment, secondary, female (% gross)
SESECENRRFE - School enrollment, secondary, male (% gross)
SESECENRRMA - School enrollment, secondary (% net)
SESECNENR - School enrollment, secondary, female (% net)
SESECNENRFE - School enrollment, secondary, male (% net)
SESECNENRMA - Trained teachers in lower secondary education (% of total teachers)
SESECTCAQLOZS - Trained teachers in upper secondary education (% of total teachers)
SESECTCAQUPZS - Trained teachers in secondary education (% of total teachers)
SESECTCAQZS - Educational attainment, at least Bachelor’s or equivalent, population 25+, female (%) (cumulative)
SETERCUATBAFEZS - Educational attainment, at least Bachelor’s or equivalent, population 25+, male (%) (cumulative)
SETERCUATBAMAZS - Educational attainment, at least Bachelor’s or equivalent, population 25+, total (%) (cumulative)
SETERCUATBAZS - Educational attainment, Doctoral or equivalent, population 25+, female (%) (cumulative)
SETERCUATDOFEZS - Educational attainment, Doctoral or equivalent, population 25+, male (%) (cumulative)
SETERCUATDOMAZS - Educational attainment, Doctoral or equivalent, population 25+, total (%) (cumulative)
SETERCUATDOZS - Educational attainment, at least Master’s or equivalent, population 25+, female (%) (cumulative)
SETERCUATMSFEZS - Educational attainment, at least Master’s or equivalent, population 25+, male (%) (cumulative)
SETERCUATMSMAZS - Educational attainment, at least Master’s or equivalent, population 25+, total (%) (cumulative)
SETERCUATMSZS - Educational attainment, at least completed short-cycle tertiary, population 25+, female (%) (cumulative)
SETERCUATSTFEZS - Educational attainment, at least completed short-cycle tertiary, population 25+, male (%) (cumulative)
SETERCUATSTMAZS - Educational attainment, at least completed short-cycle tertiary, population 25+, total (%) (cumulative)
SETERCUATSTZS - School enrollment, tertiary (% gross)
SETERENRR - School enrollment, tertiary, female (% gross)
SETERENRRFE - School enrollment, tertiary, male (% gross)
SETERENRRMA - Percentage of graduates from tertiary education graduating from Engineering, Manufacturing and Construction programmes, both sexes (%)
SETERGRADENZS - Percentage of graduates from tertiary education graduating from Health and Welfare programmes, both sexes (%)
SETERGRADHLZS - Percentage of graduates from tertiary education graduating from Services programmes, both sexes (%)
SETERGRADSVZS - Current education expenditure, primary (% of total expenditure in primary public institutions)
SEXPDCPRMZS - Current education expenditure, secondary (% of total expenditure in secondary public institutions)
SEXPDCSECZS - Current education expenditure, tertiary (% of total expenditure in tertiary public institutions)
SEXPDCTERZS - Current education expenditure, total (% of total expenditure in public institutions)
SEXPDCTOTZS - Government expenditure per student, primary (% of GDP per capita)
SEXPDPRIMPCZS - Expenditure on primary education (% of government expenditure on education)
SEXPDPRIMZS - Government expenditure per student, secondary (% of GDP per capita)
SEXPDSECOPCZS - Expenditure on secondary education (% of government expenditure on education)
SEXPDSECOZS - Government expenditure per student, tertiary (% of GDP per capita)
SEXPDTERTPCZS - Expenditure on tertiary education (% of government expenditure on education)
SEXPDTERTZS - Government expenditure on education, total (% of government expenditure)
SEXPDTOTLGBZS - Government expenditure on education, total (% of GDP)
SEXPDTOTLGDZS - Unemployment, female (% of female labor force) (modeled ILO estimate)
SLUEMTOTLFEZS - Unemployment, male (% of male labor force) (modeled ILO estimate)
SLUEMTOTLMAZS - Unemployment, total (% of total labor force) (modeled ILO estimate)
SLUEMTOTLZS - Population ages 0-14 (% of total population)
SPPOP0014TOZS - Population ages 15-64 (% of total population)
SPPOP1564TOZS - Share of all students in lower secondary education enrolled in vocational programmes (%)
UISGTVP2V - Share of all students in upper secondary education enrolled in vocational programmes (%)
UISGTVP3V
Energy & Mining WB_ENERGY
- Access to electricity, urban (% of urban population)
EGELCACCSURZS - Access to electricity (% of population)
EGELCACCSZS - GDP per unit of energy use (PPP $ per kg of oil equivalent)
EGGDPPUSEKOPP - GDP per unit of energy use (constant 2021 PPP $ per kg of oil equivalent)
EGGDPPUSEKOPPKD - Energy use (kg of oil equivalent) per $1,000 GDP (constant 2021 PPP)
EGUSECOMMGDPPKD - Energy use (kg of oil equivalent per capita)
EGUSEPCAPKGOE
Environment WB_ENVIR
- PM2.5 pollution, population exposed to levels exceeding WHO Interim Target-1 value (% of total)
ENATMPM25MCT1ZS - PM2.5 pollution, population exposed to levels exceeding WHO Interim Target-2 value (% of total)
ENATMPM25MCT2ZS - PM2.5 pollution, population exposed to levels exceeding WHO Interim Target-3 value (% of total)
ENATMPM25MCT3ZS - Water productivity, total (constant 2015 US$ GDP per cubic meter of total freshwater withdrawal)
ERGDPFWTLM3KD
External Debt WB_DEBT
- Short-term debt (% of total external debt)
DTDODDSTCZS - Debt service (PPG and IMF only, % of exports of goods, services and primary income)
DTTDSDPPFXPZS - Public and publicly guaranteed debt service (% of GNI)
DTTDSDPPGGNZS - Public and publicly guaranteed debt service (% of exports of goods, services and primary income)
DTTDSDPPGXPZS - Multilateral debt service (% of public and publicly guaranteed debt service)
DTTDSMLATPGZS
Financial Sector WB_FINANCE
- Total reserves in months of imports
FIRESTOTLMO - Consumer price index (2010 = 100)
FPCPITOTL - Deposit interest rate (%)
FRINRDPST - Real interest rate (%)
FRINRRINR - Account ownership at a financial institution or with a mobile-money-service provider, poorest 40% (% of population ages 15+)
FXOWNTOTL40ZS - Account ownership at a financial institution or with a mobile-money-service provider, richest 60% (% of population ages 15+)
FXOWNTOTL60ZS - Account ownership at a financial institution or with a mobile-money-service provider, female (% of population ages 15+)
FXOWNTOTLFEZS - Account ownership at a financial institution or with a mobile-money-service provider, male (% of population ages 15+)
FXOWNTOTLMAZS - Account ownership at a financial institution or with a mobile-money-service provider, older adults (% of population ages 25+)
FXOWNTOTLOLZS - Account ownership at a financial institution or with a mobile-money-service provider, primary education or less (% of population ages 15+)
FXOWNTOTLPLZS - Account ownership at a financial institution or with a mobile-money-service provider, secondary education or more (% of population ages 15+)
FXOWNTOTLSOZS - Account ownership at a financial institution or with a mobile-money-service provider, young adults (% of population ages 15-24)
FXOWNTOTLYGZS - Account ownership at a financial institution or with a mobile-money-service provider (% of population ages 15+)
FXOWNTOTLZS - Nonbank financial institutions’ assets to GDP (%)
GFDDDI03 - Financial system deposits to GDP (%)
GFDDDI08 - Private credit by deposit money banks and other financial institutions to GDP (%)
GFDDDI12 - Outstanding domestic private debt securities to GDP (%)
GFDDDM03 - Outstanding domestic public debt securities to GDP (%)
GFDDDM04 - Outstanding international private debt securities to GDP (%)
GFDDDM05 - Outstanding international public debt securities to GDP (%)
GFDDDM06 - International debt issues to GDP (%)
GFDDDM07 - Gross portfolio debt liabilities to GDP (%)
GFDDDM10 - Remittance inflows to GDP (%)
GFDDOI13 - Inflation, GDP deflator: linked series (annual %)
NYGDPDEFLKDZGAD - Real effective exchange rate index (2010 = 100)
PXREXREER
Gender WB_GENDER
- Literacy rate, adult female (% of females ages 15 and above)
SEADTLITRFEZS - Women participating in the three decisions (own health care, major household purchases, and visiting family) (% of women age 15-49)
SGDMKALLDFNZS - Women making their own informed decisions regarding sexual relations, contraceptive use and reproductive health care (% of women age 15-49)
SGDMKSRCRFNZS
Health WB_HEALTH
- Condom use, population ages 15-24, female (% of females ages 15-24)
SHCON1524FEZS - Condom use, population ages 15-24, male (% of males ages 15-24)
SHCON1524MAZS - Women’s share of population ages 15+ living with HIV (%)
SHDYNAIDSFEZS - Mortality rate, under-5 (per 1,000 live births)
SHDYNMORT - People using at least basic drinking water services (% of population)
SHH2OBASWZS - People using safely managed drinking water services (% of population)
SHH2OSMDWZS - ARI treatment (% of children under 5 taken to a health provider)
SHSTAARICZS - People using at least basic sanitation services (% of population)
SHSTABASSZS - Births attended by skilled health staff (% of total)
SHSTABRTCZS - Diabetes prevalence (% of population ages 20 to 79)
SHSTADIABZS - People using safely managed sanitation services (% of population)
SHSTASMSSZS - Mortality rate attributed to unsafe water, unsafe sanitation and lack of hygiene (per 100,000 population)
SHSTAWASHP5 - Proportion of population pushed further below the $2.15 ($ 2017 PPP) poverty line by out-of-pocket health care expenditure (%)
SHUHCFBP1ZS - Proportion of population pushed further below the $3.65 ($ 2017 PPP) poverty line by out-of-pocket health care expenditure (%)
SHUHCFBP2ZS - Proportion of population pushed further below the 60% median consumption poverty line by out-of-pocket health care expenditure (%)
SHUHCFBPRZS - Increase in poverty gap at $1.90 ($ 2011 PPP) poverty line due to out-of-pocket health care expenditure (USD)
SHUHCNOP1CG - Number of people pushed below the $2.15 ($ 2017 PPP) poverty line by out-of-pocket health care expenditure
SHUHCNOP1TO - Increase in poverty gap at $1.90 ($ 2011 PPP) poverty line due to out-of-pocket health care expenditure (% of poverty line)
SHUHCNOP1ZG - Proportion of population pushed below the $2.15 ($ 2017 PPP) poverty line by out-of-pocket health care expenditure (%)
SHUHCNOP1ZS - Increase in poverty gap at $3.20 ($ 2011 PPP) poverty line due to out-of-pocket health care expenditure (USD)
SHUHCNOP2CG - Number of people pushed below the $3.65 ($ 2017 PPP) poverty line by out-of-pocket health care expenditure
SHUHCNOP2TO - Increase in poverty gap at $3.20 ($ 2011 PPP) poverty line due to out-of-pocket health care expenditure (% of poverty line)
SHUHCNOP2ZG - Proportion of population pushed below the $3.65 ($ 2017 PPP) poverty line by out-of-pocket health care expenditure (%)
SHUHCNOP2ZS - Proportion of population pushed below the 60% median consumption poverty line by out-of-pocket health expenditure (%)
SHUHCNOPRZS - Number of people spending more than 10% of household consumption or income on out-of-pocket health care expenditure
SHUHCOOPC10TO - Proportion of population spending more than 10% of household consumption or income on out-of-pocket health care expenditure (%)
SHUHCOOPC10ZS - Number of people spending more than 25% of household consumption or income on out-of-pocket health care expenditure
SHUHCOOPC25TO - Proportion of population spending more than 25% of household consumption or income on out-of-pocket health care expenditure (%)
SHUHCOOPC25ZS - Proportion of population pushed or further pushed below the $2.15 ($ 2017 PPP) poverty line by out-of-pocket health care expenditure (%)
SHUHCTOT1ZS - Proportion of population pushed or further pushed below the $3.65 ($ 2017 PPP) poverty line by out-of-pocket health care expenditure (%)
SHUHCTOT2ZS - Proportion of population pushed or further pushed below the 60% median consumption poverty line by out-of-pocket health expenditure (%)
SHUHCTOTRZS - Current health expenditure (% of GDP)
SHXPDCHEXGDZS - Current health expenditure per capita (current US$)
SHXPDCHEXPCCD - Current health expenditure per capita, PPP (current international $)
SHXPDCHEXPPCD - External health expenditure (% of current health expenditure)
SHXPDEHEXCHZS - External health expenditure per capita (current US$)
SHXPDEHEXPCCD - External health expenditure per capita, PPP (current international $)
SHXPDEHEXPPCD - Domestic general government health expenditure (% of current health expenditure)
SHXPDGHEDCHZS - Domestic general government health expenditure (% of GDP)
SHXPDGHEDGDZS - Domestic general government health expenditure (% of general government expenditure)
SHXPDGHEDGEZS - Domestic general government health expenditure per capita (current US$)
SHXPDGHEDPCCD - Domestic general government health expenditure per capita, PPP (current international $)
SHXPDGHEDPPCD - Out-of-pocket expenditure (% of current health expenditure)
SHXPDOOPCCHZS - Health expenditure, private (% of total health expenditure)
SHXPDPRIV - Domestic private health expenditure (% of current health expenditure)
SHXPDPVTDCHZS - Domestic private health expenditure per capita (current US$)
SHXPDPVTDPCCD - Domestic private health expenditure per capita, PPP (current international $)
SHXPDPVTDPPCD - Prevalence of moderate or severe food insecurity in the population (%)
SNITKMSFIZS - Prevalence of severe food insecurity in the population (%)
SNITKSVFIZS - Mortality rate, infant, female (per 1,000 live births)
SPDYNIMRTFEIN - Mortality rate, infant (per 1,000 live births)
SPDYNIMRTIN - Mortality rate, infant, male (per 1,000 live births)
SPDYNIMRTMAIN - Life expectancy at birth, total (years)
SPDYNLE00IN - Population ages 00-04, female (% of female population)
SPPOP0004FE5Y - Population ages 00-04, male (% of male population)
SPPOP0004MA5Y - Population ages 0-14, female (% of female population)
SPPOP0014FEZS - Population ages 0-14, male (% of male population)
SPPOP0014MAZS - Population ages 05-09, female (% of female population)
SPPOP0509FE5Y - Population ages 05-09, male (% of male population)
SPPOP0509MA5Y - Population ages 10-14, female (% of female population)
SPPOP1014FE5Y - Population ages 10-14, male (% of male population)
SPPOP1014MA5Y - Population ages 15-19, female (% of female population)
SPPOP1519FE5Y - Population ages 15-19, male (% of male population)
SPPOP1519MA5Y - Population ages 15-64, female (% of female population)
SPPOP1564FEZS - Population ages 15-64, male (% of male population)
SPPOP1564MAZS - Population ages 20-24, female (% of female population)
SPPOP2024FE5Y - Population ages 20-24, male (% of male population)
SPPOP2024MA5Y - Population ages 25-29, female (% of female population)
SPPOP2529FE5Y - Population ages 25-29, male (% of male population)
SPPOP2529MA5Y - Population ages 30-34, female (% of female population)
SPPOP3034FE5Y - Population ages 30-34, male (% of male population)
SPPOP3034MA5Y - Population ages 35-39, female (% of female population)
SPPOP3539FE5Y - Population ages 35-39, male (% of male population)
SPPOP3539MA5Y - Population ages 40-44, female (% of female population)
SPPOP4044FE5Y - Population ages 40-44, male (% of male population)
SPPOP4044MA5Y - Population ages 45-49, female (% of female population)
SPPOP4549FE5Y - Population ages 45-49, male (% of male population)
SPPOP4549MA5Y - Population ages 50-54, female (% of female population)
SPPOP5054FE5Y - Population ages 50-54, male (% of male population)
SPPOP5054MA5Y - Population ages 55-59, female (% of female population)
SPPOP5559FE5Y - Population ages 55-59, male (% of male population)
SPPOP5559MA5Y - Population ages 60-64, female (% of female population)
SPPOP6064FE5Y - Population ages 60-64, male (% of male population)
SPPOP6064MA5Y - Population ages 65-69, female (% of female population)
SPPOP6569FE5Y - Population ages 65-69, male (% of male population)
SPPOP6569MA5Y - Population ages 65 and above, female (% of female population)
SPPOP65UPFEZS - Population ages 65 and above, male (% of male population)
SPPOP65UPMAZS - Population ages 65 and above (% of total population)
SPPOP65UPTOZS - Population ages 70-74, female (% of female population)
SPPOP7074FE5Y - Population ages 70-74, male (% of male population)
SPPOP7074MA5Y - Population ages 75-79, female (% of female population)
SPPOP7579FE5Y - Population ages 75-79, male (% of male population)
SPPOP7579MA5Y - Population ages 80 and above, female (% of female population)
SPPOP80UPFE5Y - Population ages 80 and above, male (% of male population)
SPPOP80UPMA5Y - Population, female (% of total population)
SPPOPTOTLFEZS - Population, male (% of total population)
SPPOPTOTLMAZS
Infrastructure WB_INFRSTR
- Investment in water and sanitation with private participation (current US$)
IEPPIWATRCD - Public private partnerships investment in water and sanitation (current US$)
IEPPNWATRCD - ICT goods imports (% total goods imports)
TMVALICTGZSUN - ICT goods exports (% of total goods exports)
TXVALICTGZSUN
Poverty WB_POVERTY
- Labor Income Poverty Index
80LIPI - Population living in slums (% of urban population)
ENPOPSLUMURZS - Poverty headcount ratio at $2.15 a day (2017 PPP) (% of population)
SIPOVDDAY - Poverty gap at $2.15 a day (2017 PPP) (%)
SIPOVGAPS - Gini index
SIPOVGINI - Poverty headcount ratio at $3.65 a day (2017 PPP) (% of population)
SIPOVLMIC - Poverty gap at $3.65 a day (2017 PPP) (%)
SIPOVLMICGP - Multidimensional poverty headcount ratio, children (% of population ages 0-17)
SIPOVMDIM17 - Multidimensional poverty index (scale 0-1)
SIPOVMDIMXQ - Poverty headcount ratio at national poverty lines (% of population)
SIPOVNAHC - Poverty headcount ratio at $6.85 a day (2017 PPP) (% of population)
SIPOVUMIC - Poverty gap at $6.85 a day (2017 PPP) (%)
SIPOVUMICGP - Survey mean consumption or income per capita, bottom 40% of population (2017 PPP $ per day)
SISPRPC40 - Annualized average growth rate in per capita real survey mean consumption or income, bottom 40% of population (%)
SISPRPC40ZG - Survey mean consumption or income per capita, total population (2017 PPP $ per day)
SISPRPCAP - Annualized average growth rate in per capita real survey mean consumption or income, total population (%)
SISPRPCAPZG
Private Sector WB_PRIVATE
- Logistics performance index: Quality of trade and transport-related infrastructure (1=low to 5=high)
LPLPIINFRXQ - Merchandise trade (% of GDP)
TGVALTOTLGDZS - Insurance and financial services (% of commercial service imports)
TMVALINSFZSWT - Merchandise imports by the reporting economy, residual (% of total merchandise imports)
TMVALMRCHRSZS - Commercial service imports (current US$)
TMVALSERVCDWT - Net barter terms of trade index (2015 = 100)
TTPRIMRCHXDWD - Insurance and financial services (% of commercial service exports)
TXVALINSFZSWT - Merchandise exports by the reporting economy, residual (% of total merchandise exports)
TXVALMRCHRSZS - Commercial service exports (current US$)
TXVALSERVCDWT
Public Sector WB_PUBLIC
- Central government debt, total (current LCU)
GCDODTOTLCN - Taxes on exports (% of tax revenue)
GCTAXEXPTZS - Taxes on goods and services (% value added of industry and services)
GCTAXGSRVVAZS - CPIA business regulatory environment rating (1=low to 6=high)
IQCPABREGXQ - CPIA debt policy rating (1=low to 6=high)
IQCPADEBTXQ - CPIA economic management cluster average (1=low to 6=high)
IQCPAECONXQ - CPIA policy and institutions for environmental sustainability rating (1=low to 6=high)
IQCPAENVRXQ - CPIA quality of budgetary and financial management rating (1=low to 6=high)
IQCPAFINQXQ - CPIA financial sector rating (1=low to 6=high)
IQCPAFINSXQ - CPIA fiscal policy rating (1=low to 6=high)
IQCPAFISPXQ - CPIA gender equality rating (1=low to 6=high)
IQCPAGNDRXQ - CPIA building human resources rating (1=low to 6=high)
IQCPAHRESXQ - CPIA macroeconomic management rating (1=low to 6=high)
IQCPAMACRXQ - CPIA quality of public administration rating (1=low to 6=high)
IQCPAPADMXQ - CPIA equity of public resource use rating (1=low to 6=high)
IQCPAPRESXQ - CPIA property rights and rule-based governance rating (1=low to 6=high)
IQCPAPROPXQ - CPIA social protection rating (1=low to 6=high)
IQCPAPROTXQ - CPIA efficiency of revenue mobilization rating (1=low to 6=high)
IQCPAREVNXQ - CPIA policies for social inclusion/equity cluster average (1=low to 6=high)
IQCPASOCIXQ - CPIA structural policies cluster average (1=low to 6=high)
IQCPASTRCXQ - CPIA trade rating (1=low to 6=high)
IQCPATRADXQ - CPIA transparency, accountability, and corruption in the public sector rating (1=low to 6=high)
IQCPATRANXQ
Science & Technology WB_SCIENCE
Social Development WB_SOCIAL_DEV
Social Protection & Labor WB_LABOUR
- Gini inequality index reduction (%) – All Social Protection and Labor -rural
PERALLSPGINIRUR - Gini inequality index reduction (%) – All Social Protection and Labor
PERALLSPGINITOT - Gini inequality index reduction (%) – All Social Protection and Labor -urban
PERALLSPGINIURB - Gini inequality index reduction (%) – Active Labor Market -rural
PERLMACGINIRUR - Gini inequality index reduction (%) – Active Labor Market
PERLMACGINITOT - Gini inequality index reduction (%) – Active Labor Market -urban
PERLMACGINIURB - Adequacy of unemployment benefits and ALMP (% of total welfare of beneficiary households)
PERLMALLLMADQPOPTOT - Benefit incidence of unemployment benefits and ALMP to poorest quintile (% of total U/ALMP benefits)
PERLMALLLMBENQ1TOT - Coverage of unemployment benefits and ALMP (% of population)
PERLMALLLMCOVPOPTOT - Coverage of unemployment benefits and ALMP in poorest quintile (% of population)
PERLMALLLMCOVQ1TOT - Coverage of unemployment benefits and ALMP in 2nd quintile (% of population)
PERLMALLLMCOVQ2TOT - Coverage of unemployment benefits and ALMP in 3rd quintile (% of population)
PERLMALLLMCOVQ3TOT - Coverage of unemployment benefits and ALMP in 4th quintile (% of population)
PERLMALLLMCOVQ4TOT - Coverage of unemployment benefits and ALMP in richest quintile (% of population)
PERLMALLLMCOVQ5TOT - Gini inequality index reduction (%) – All Labor Market -rural
PERLMALLLMGINIRUR - Gini inequality index reduction (%) – All Labor Market
PERLMALLLMGINITOT - Gini inequality index reduction (%) – All Labor Market -urban
PERLMALLLMGINIURB - Gini inequality index reduction (%) – Domestic Private Transfers -rural
PERPRDPGINIRUR - Gini inequality index reduction (%) – Domestic Private Transfers
PERPRDPGINITOT - Gini inequality index reduction (%) – Domestic Private Transfers -urban
PERPRDPGINIURB - Gini inequality index reduction (%) – International Private Transfers -rural
PERPRIPGINIRUR - Gini inequality index reduction (%) – International Private Transfers
PERPRIPGINITOT - Gini inequality index reduction (%) – International Private Transfers -urban
PERPRIPGINIURB - Gini inequality index reduction (%) – All Social Assistance -rural
PERSAALLSAGINIRUR - Gini inequality index reduction (%) – All Social Assistance
PERSAALLSAGINITOT - Gini inequality index reduction (%) – All Social Assistance -urban
PERSAALLSAGINIURB - Gini inequality index reduction (%) – Unconditional Cash Transfers -rural
PERSACTGINIRUR - Gini inequality index reduction (%) – Unconditional Cash Transfers
PERSACTGINITOT - Gini inequality index reduction (%) – Unconditional Cash Transfers -urban
PERSACTGINIURB - Gini inequality index reduction (%) – In-Kind -rural
PERSAIKGINIRUR - Gini inequality index reduction (%) – In-Kind
PERSAIKGINITOT - Gini inequality index reduction (%) – In-Kind -urban
PERSAIKGINIURB - Gini inequality index reduction (%) – Public Works -rural
PERSAPWGINIRUR - Gini inequality index reduction (%) – Public Works
PERSAPWGINITOT - Gini inequality index reduction (%) – Public Works -urban
PERSAPWGINIURB - Gini inequality index reduction (%) – School-feeding -rural
PERSASFGINIRUR - Gini inequality index reduction (%) – School-feeding
PERSASFGINITOT - Gini inequality index reduction (%) – School-feeding -urban
PERSASFGINIURB - Gini inequality index reduction (%) – Social Pension-rural
PERSASPGINIRUR - Gini inequality index reduction (%) – Social Pension
PERSASPGINITOT - Gini inequality index reduction (%) – Social Pension -urban
PERSASPGINIURB - Gini inequality index reduction (%) – All Social Insurance -rural
PERSIALLSIGINIRUR - Gini inequality index reduction (%) – All Social Insurance
PERSIALLSIGINITOT - Gini inequality index reduction (%) – All Social Insurance -urban
PERSIALLSIGINIURB - Gini inequality index reduction (%) – Other Social Insurance -rural
PERSISSGINIRUR - Gini inequality index reduction (%) – Other Social Insurance
PERSISSGINITOT - Gini inequality index reduction (%) – Other Social Insurance -urban
PERSISSGINIURB - Child employment in agriculture, female (% of female economically active children ages 7-14)
SLAGR0714FEZS - Child employment in agriculture, male (% of male economically active children ages 7-14)
SLAGR0714MAZS - Child employment in agriculture (% of economically active children ages 7-14)
SLAGR0714ZS - Employment to population ratio, ages 15-24, female (%) (national estimate)
SLEMP1524SPFENEZS - Employment to population ratio, ages 15-24, female (%) (modeled ILO estimate)
SLEMP1524SPFEZS - Employment to population ratio, ages 15-24, male (%) (national estimate)
SLEMP1524SPMANEZS - Employment to population ratio, ages 15-24, male (%) (modeled ILO estimate)
SLEMP1524SPMAZS - Employment to population ratio, ages 15-24, total (%) (national estimate)
SLEMP1524SPNEZS - Employment to population ratio, ages 15-24, total (%) (modeled ILO estimate)
SLEMP1524SPZS - Female share of employment in senior and middle management (%)
SLEMPSMGTFEZS - Employment to population ratio, 15+, female (%) (national estimate)
SLEMPTOTLSPFENEZS - Employment to population ratio, 15+, female (%) (modeled ILO estimate)
SLEMPTOTLSPFEZS - Employment to population ratio, 15+, male (%) (national estimate)
SLEMPTOTLSPMANEZS - Employment to population ratio, 15+, male (%) (modeled ILO estimate)
SLEMPTOTLSPMAZS - Employment to population ratio, 15+, total (%) (national estimate)
SLEMPTOTLSPNEZS - Employment to population ratio, 15+, total (%) (modeled ILO estimate)
SLEMPTOTLSPZS - GDP per person employed (constant 2021 PPP $)
SLGDPPCAPEMKD - Employment in industry, female (% of female employment) (modeled ILO estimate)
SLINDEMPLFEZS - Employment in industry, male (% of male employment) (modeled ILO estimate)
SLINDEMPLMAZS - Employment in industry (% of total employment) (modeled ILO estimate)
SLINDEMPLZS - Child employment in manufacturing, female (% of female economically active children ages 7-14)
SLMNF0714FEZS - Child employment in manufacturing, male (% of male economically active children ages 7-14)
SLMNF0714MAZS - Child employment in manufacturing (% of economically active children ages 7-14)
SLMNF0714ZS - Child employment in services, female (% of female economically active children ages 7-14)
SLSRV0714FEZS - Child employment in services, male (% of male economically active children ages 7-14)
SLSRV0714MAZS - Child employment in services (% of economically active children ages 7-14)
SLSRV0714ZS - Employment in services, female (% of female employment) (modeled ILO estimate)
SLSRVEMPLFEZS - Employment in services, male (% of male employment) (modeled ILO estimate)
SLSRVEMPLMAZS - Employment in services (% of total employment) (modeled ILO estimate)
SLSRVEMPLZS - Labor force participation rate, female (% of female population ages 15-64) (modeled ILO estimate)
SLTLFACTIFEZS - Labor force participation rate, male (% of male population ages 15-64) (modeled ILO estimate)
SLTLFACTIMAZS - Labor force participation rate, total (% of total population ages 15-64) (modeled ILO estimate)
SLTLFACTIZS - Labor force with advanced education, female (% of female working-age population with advanced education)
SLTLFADVNFEZS - Labor force with advanced education, male (% of male working-age population with advanced education)
SLTLFADVNMAZS - Labor force with advanced education (% of total working-age population with advanced education)
SLTLFADVNZS - Labor force with basic education, female (% of female working-age population with basic education)
SLTLFBASCFEZS - Labor force with basic education, male (% of male working-age population with basic education)
SLTLFBASCMAZS - Labor force with basic education (% of total working-age population with basic education)
SLTLFBASCZS - Labor force participation rate, female (% of female population ages 15+) (national estimate)
SLTLFCACTFENEZS - Labor force participation rate, female (% of female population ages 15+) (modeled ILO estimate)
SLTLFCACTFEZS - Labor force participation rate, male (% of male population ages 15+) (national estimate)
SLTLFCACTMANEZS - Labor force participation rate, male (% of male population ages 15+) (modeled ILO estimate)
SLTLFCACTMAZS - Labor force participation rate, total (% of total population ages 15+) (national estimate)
SLTLFCACTNEZS - Labor force participation rate, total (% of total population ages 15+) (modeled ILO estimate)
SLTLFCACTZS - Labor force with intermediate education, female (% of female working-age population with intermediate education)
SLTLFINTMFEZS - Labor force with intermediate education, male (% of male working-age population with intermediate education)
SLTLFINTMMAZS - Labor force with intermediate education (% of total working-age population with intermediate education)
SLTLFINTMZS - Unemployment, youth female (% of female labor force ages 15-24) (national estimate)
SLUEM1524FENEZS - Unemployment, youth female (% of female labor force ages 15-24) (modeled ILO estimate)
SLUEM1524FEZS - Unemployment, youth male (% of male labor force ages 15-24) (national estimate)
SLUEM1524MANEZS - Unemployment, youth male (% of male labor force ages 15-24) (modeled ILO estimate)
SLUEM1524MAZS - Unemployment, youth total (% of total labor force ages 15-24) (national estimate)
SLUEM1524NEZS - Unemployment, youth total (% of total labor force ages 15-24) (modeled ILO estimate)
SLUEM1524ZS - Unemployment with advanced education, female (% of female labor force with advanced education)
SLUEMADVNFEZS - Unemployment with advanced education, male (% of male labor force with advanced education)
SLUEMADVNMAZS - Unemployment with advanced education (% of total labor force with advanced education)
SLUEMADVNZS - Unemployment with basic education, female (% of female labor force with basic education)
SLUEMBASCFEZS - Unemployment with basic education, male (% of male labor force with basic education)
SLUEMBASCMAZS - Unemployment with basic education (% of total labor force with basic education)
SLUEMBASCZS - Unemployment with intermediate education, female (% of female labor force with intermediate education)
SLUEMINTMFEZS - Unemployment with intermediate education, male (% of male labor force with intermediate education)
SLUEMINTMMAZS - Unemployment with intermediate education (% of total labor force with intermediate education)
SLUEMINTMZS - Share of youth not in education, employment or training, female (% of female youth population) (modeled ILO estimate)
SLUEMNEETFEMEZS - Share of youth not in education, employment or training, female (% of female youth population)
SLUEMNEETFEZS - Share of youth not in education, employment or training, male (% of male youth population) (modeled ILO estimate)
SLUEMNEETMAMEZS - Share of youth not in education, employment or training, male (% of male youth population)
SLUEMNEETMAZS - Share of youth not in education, employment or training, total (% of youth population) (modeled ILO estimate)
SLUEMNEETMEZS - Share of youth not in education, employment or training, total (% of youth population)
SLUEMNEETZS - Unemployment with secondary education (% of total unemployment)
SLUEMSECOZS - Unemployment, female (% of female labor force) (national estimate)
SLUEMTOTLFENEZS - Unemployment, male (% of male labor force) (national estimate)
SLUEMTOTLMANEZS - Unemployment, total (% of total labor force) (national estimate)
SLUEMTOTLNEZS
Trade WB_TRADE
Urban Development WB_URBAN
- PM2.5 air pollution, population exposed to levels exceeding WHO guideline value (% of total)
ENATMPM25MCZS
Global Economic Monitor WB_GEM
- Core CPI,not seas.adj,,,
CORENS - Core CPI,seas.adj,,,
CORESA - CPI Price, nominal
CPTOTNSXN - CPI Price, nominal, seas. adj.
CPTOTSAXN - CPI Price, % y-o-y, nominal, seas. adj.
CPTOTSAXNZGY - Imports Merchandise, Customs, current US$, millions
DMGSRMRCHNSCD - Imports Merchandise, Customs, constant US$, millions
DMGSRMRCHNSKD - Imports Merchandise, Customs, Price, US$
DMGSRMRCHNSXD - Imports Merchandise, Customs, current US$, millions, seas. adj.
DMGSRMRCHSACD - Imports Merchandise, Customs, constant US$, millions, seas. adj.
DMGSRMRCHSAKD - Imports Merchandise, Customs, Price, US$, seas. adj.
DMGSRMRCHSAXD - Official exchange rate, LCU per USD, period average
DPANUSLCU - Exchange rate, new LCU per USD extended backward, period average
DPANUSSPB - Exchange rate, old LCU per USD extended forward, period average
DPANUSSPF - Stock Markets, US$
DSTKMKTXD - Stock Markets, LCU
DSTKMKTXN - Exports Merchandise, Customs, current US$, millions
DXGSRMRCHNSCD - Exports Merchandise, Customs, constant US$, millions
DXGSRMRCHNSKD - Exports Merchandise, Customs, Price, US$
DXGSRMRCHNSXD - Exports Merchandise, Customs, current US$, millions, seas. adj.
DXGSRMRCHSACD - Exports Merchandise, Customs, constant US$, millions, seas. adj.
DXGSRMRCHSAKD - Exports Merchandise, Customs, Price, US$, seas. adj.
DXGSRMRCHSAXD - Foreign Reserves, Months Import Cover, Goods
IMPCOV - Industrial Production, constant US$
IPTOTNSKD - Industrial Production, constant US$, seas. adj.
IPTOTSAKD - Nominal Effective Exchange Rate
NEER - GDP,current US$,millions,seas. adj.,
NYGDPMKTPSACD - GDP,current LCU,millions,seas. adj.,
NYGDPMKTPSACN - GDP,constant 2010 US$,millions,seas. adj.,
NYGDPMKTPSAKD - GDP,constant 2010 LCU,millions,seas. adj.,
NYGDPMKTPSAKN - Real Effective Exchange Rate
REER - Retail Sales Volume,Index,,,
RETSALESSA - Total Reserves
TOTRESV - Unemployment rate,Percent,,,
UNEMPSA
2. Country
The country is the second dimension in the series key, using the ISO two-character code. Please click on this paragraph to see the alphabetically-ordered list of the 100 countries we have loaded.
- United Arab Emirates (The)
AE - Angola
AO - Argentina
AR - Austria
AT - Australia
AU - Azerbaijan
AZ - Bangladesh
BD - Belgium
BE - Bulgaria
BG - Bahrain
BH - Bolivia (Plurinational State Of)
BO - Brazil
BR - Belarus
BY - Canada
CA - Congo (The Democratic Republic Of The)
CD - Switzerland
CH - Côte D’ivoire
CI - Chile
CL - Cameroon
CM - China
CN - Colombia
CO - Costa Rica
CR - Czech Republic (The)
CZ - Germany
DE - Denmark
DK - Dominican Republic (The)
DO - Algeria
DZ - Ecuador
EC - Egypt
EG - Spain
ES - Ethiopia
ET - Finland
FI - France
FR - United Kingdom Of Great Britain and Northern Ireland (The)
GB - Georgia
GE - Ghana
GH - Greece
GR - Guatemala
GT - Hong Kong
HK - Croatia
HR - Hungary
HU - Indonesia
ID - Ireland
IE - Israel
IL - India
IN - Iraq
IQ - Iran (Islamic Republic Of)
IR - Italy
IT - Jordan
JO - Japan
JP - Kenya
KE - Cambodia
KH - Korea (The Republic Of)
KR - Kuwait
KW - Kazakhstan
KZ - Sri Lanka
LK - Lithuania
LT - Luxembourg
LU - Libya
LY - Morocco
MA - Myanmar
MM - Mexico
MX - Malaysia
MY - Nigeria
NG - Netherlands (The)
NL - Norway
NO - Nepal
NP - New Zealand
NZ - Oman
OM - Panama
PA - Peru
PE - Philippines (The)
PH - Pakistan
PK - Poland
PL - Puerto Rico
PR - Portugal
PT - Paraguay
PY - Qatar
QA - Romania
RO - Serbia
RS - Russian Federation (The)
RU - Saudi Arabia
SA - Sudan (The)
SD - Sweden
SE - Singapore
SG - Slovenia
SI - Slovakia
SK - Syrian Arab Republic
SY - Eswatini
SZ - Thailand
TH - Turkmenistan
TM - Tunisia
TN - Turkey
TR - Tanzania, United Republic Of
TZ - Ukraine
UA - Uganda
UG - United States Of America (The)
US - Uruguay
UY - Uzbekistan
UZ - VietNam
VN - South Africa (The Republic Of)
ZA
International Categories