We are pleased to announce the launch of EconData’s Python Package! While the package is still experimental and limited in its feature set, it is ready to be used for downloading time series data from EconData.
To use the package, first sign up for an EconData account, then install
pip install -i https://test.pypi.org/simple/ econdatapy
To download data from EconData you must import the read module
from econdatapy import read

x = read.dataset(id,
                 agencyid = agencyid,
                 version = version,
                 release = release,
                 series_key = series_key,
                 release = release)
The only required parameter is the data set id (see available data), the named arguments are optional: agencyid defaults to “ECONDATA”, version defaults to “latest”, series_key defaults to all series, release defaults to the current date and time – you can specify the release as a date and time “yyyy-dd-mmTHH:MM:SS” or you can use the release description (as found on the EconData web application).
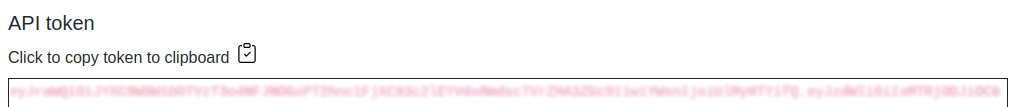
When you run the code below you will be prompted for an API token
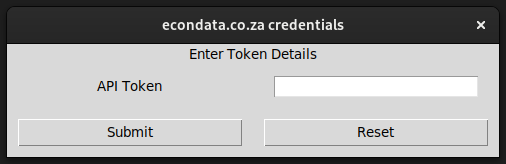
You will find this token in the Accounts page of the EconData web application, click on the token to copy it onto the clipboard and paste it into the Python promp, then click submit
Once read from EconData the data is returned as a Python dictionary with two fields metadata and data. The metadata field contains the details of the data set metadata, and the data field contains a named field (time series key) for each time series which itself is represented by a pandas DataFrame. Each DataFrame also has a metadata attribute that details the metadata of the time series.
>>> from econdatapy import read
>>> x = read.dataset("MINING")
Fetching dataset(s) - MINING
Processing data set: ECONDATA-MINING-1.1.0
>>> x["metadata"]
{'agencyid': 'ECONDATA', 'id': 'MINING', 'version': '1.1.0', 'name': ['en', 'Mining'], 'provision-agreement': ['#sdmx.infomodel.registry.ProvisionAgreementRef', {'agencyid': 'ECONDATA', 'id': 'MINING_ECONDATA_STATSSA', 'version': '1.1.0'}], 'SOURCE_DATASET': 'P2041'}
>>> y = x["data"]
>>> y["MIN001.I.N"]
TIME_PERIOD OBS_VALUE
0 1980-01-01 105.2
1 1980-02-01 105.6
2 1980-03-01 105.1
3 1980-04-01 105.8
4 1980-05-01 108.7
.. ... ...
525 2023-10-01 96.0
526 2023-11-01 99.9
527 2023-12-01 88.5
528 2024-01-01 80.7
529 2024-02-01 82.9
[530 rows x 2 columns]
>>> y["MIN001.I.N"].metadata
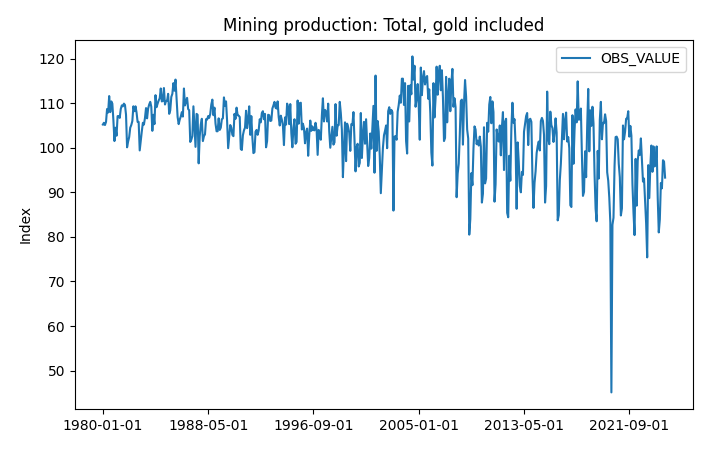
{'MNEMONIC': 'MIN001', 'FREQ': 'M', 'BASE_PER': '2019', 'series-key': 'MIN001.I.N', 'MEASURE': 'I', 'SEASONAL_ADJUST': 'N', 'UNIT_MEASURE': 'Index', 'SOURCE_IDENTIFIER': 'FMP20000', 'LABEL': 'Total, gold included'}
>>> z = y["MIN001.I.N"]
>>> z.index = z["TIME_PERIOD"]
>>> _ = z.plot(title="Mining production: Total, gold included", ylabel="Index", xlabel="")
>>> import matplotlib.pyplot as plt
>>> plt.show()