This help file outlines which software you can use to access EconData.
Excel Add-In
Our EconData Excel Add-In pulls the latest, up-to-date time series data (from any of the datasets supplied in EconData) into your Excel workbooks. The series will be structured as two columns with some headers: the left-hand column gives the date and the right-hand column gives the values. You can, for example, overwrite previous data downloads to update graphs or quantitative models which are linked to that range.
To use the Excel Add-In, first create an account on www.EconData.co.za, then, in Excel, go to the Insert ribbon → Add-ins → Get Add-ins → search for “EconData” → add the app → and sign in to the app, using your EconData credentials.
For more guidance, please see our tutorial.
R package ☍
The R package can be installed with the following sequence of commands, in R:
library(remotes)
install_github("coderaanalytics/econdatar@4.0.1")
library(econdatar)
See also this blog post.
Please run the following lines of code, to engage with our short EconDataR Swirl course.
install.packages("swirl")
library(swirl)
install_course_github("coderaanalytics-projects", "swirl-econdatar")
Then run swirl() and interact with the Swirl course.
Extracting data in R
An example of how you can extract structured data, using the read_dataset() function, is as follows.
library(tibble)
library(econdatar)

data_raw <- read_dataset(id = "POPULATION_DATA",
                         release = "latest",
                         version = "latest",
                         tidy = TRUE,
                         wide = FALSE,
                         combine = TRUE) |> as_tibble()

names(data_raw)
dim(data_raw)
You thus need to use a dataset ID when calling the data. We outline the IDs in Available Data.
Relational Data
Instead of the option combine = TRUE, you could specify compact = FALSE, which will split the data into two tables (in a list), the data table and the meta-data table. These can be linked with the series key (a concise encoding of the dimensions). The data table contains the time period, values, and the series key. The meta-data table gives more, time-invariant detail for each series. We have sample code like this on GitHub, at econdata-blog/docs/concept-checker.R
Full details about the read_dataset() function.
Authenticating
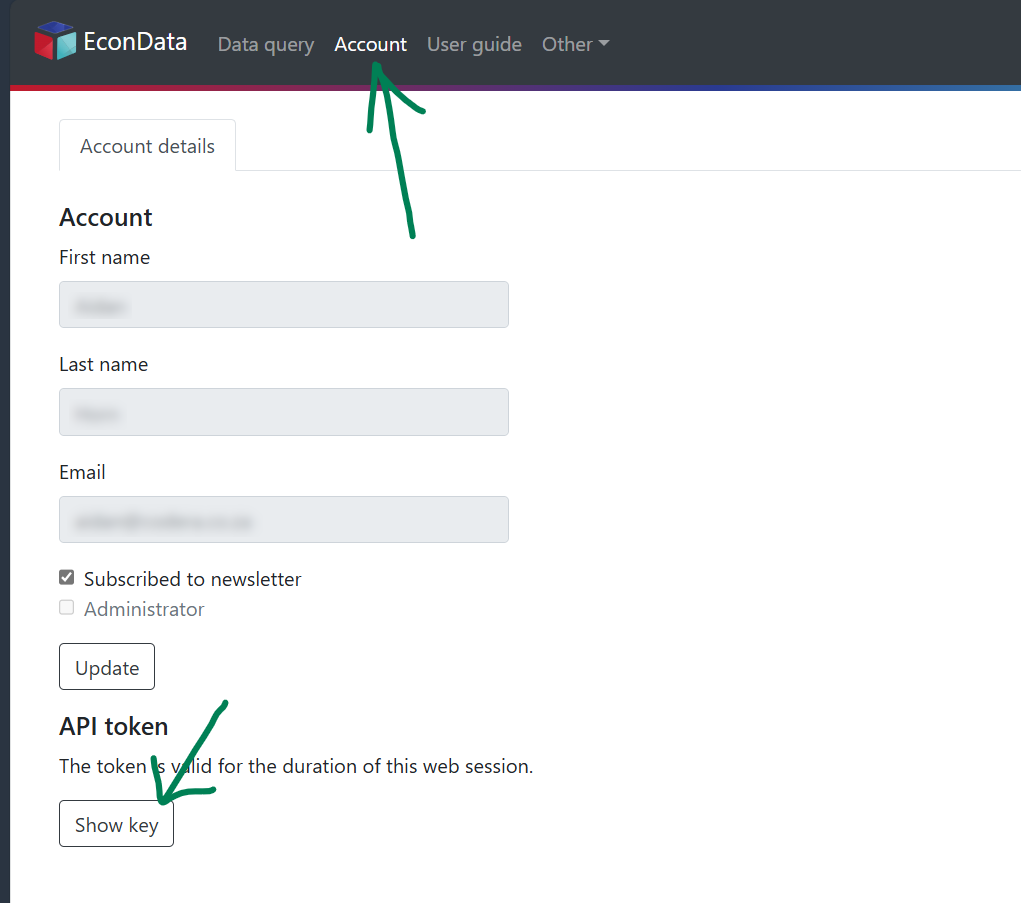
For each session, you will need to use your API key. Please go to the “Account” tab in the app and generate an API token, which is temporary.
You can copy it from there, and paste it into the dialogue box which pops up. At the moment, Mac users need to use Ctrl + V here (not Cmd + V).
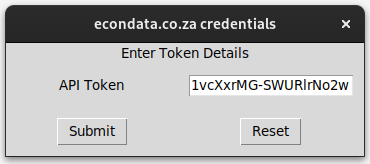
Click on “Submit”, and then your EconDataR package will be able to connect to our database for the duration of your R session.
If you find that you made a mistake with this process, and you don’t want to terminate your R session, you can run
detach("package:econdatar", unload=TRUE)
require("econdatar")
in order to re-load the EconDataR package.
Python package
Please run
pip install -i https://test.pypi.org/simple/ econdatapy
in the terminal, in order to install our Python package. See this blog post.